Brief Introduction To Digital Maps, and Maps That Explain How Our World Works
Overview of Digital Maps
Raster Image Format Maps
You might be used to maps like this :
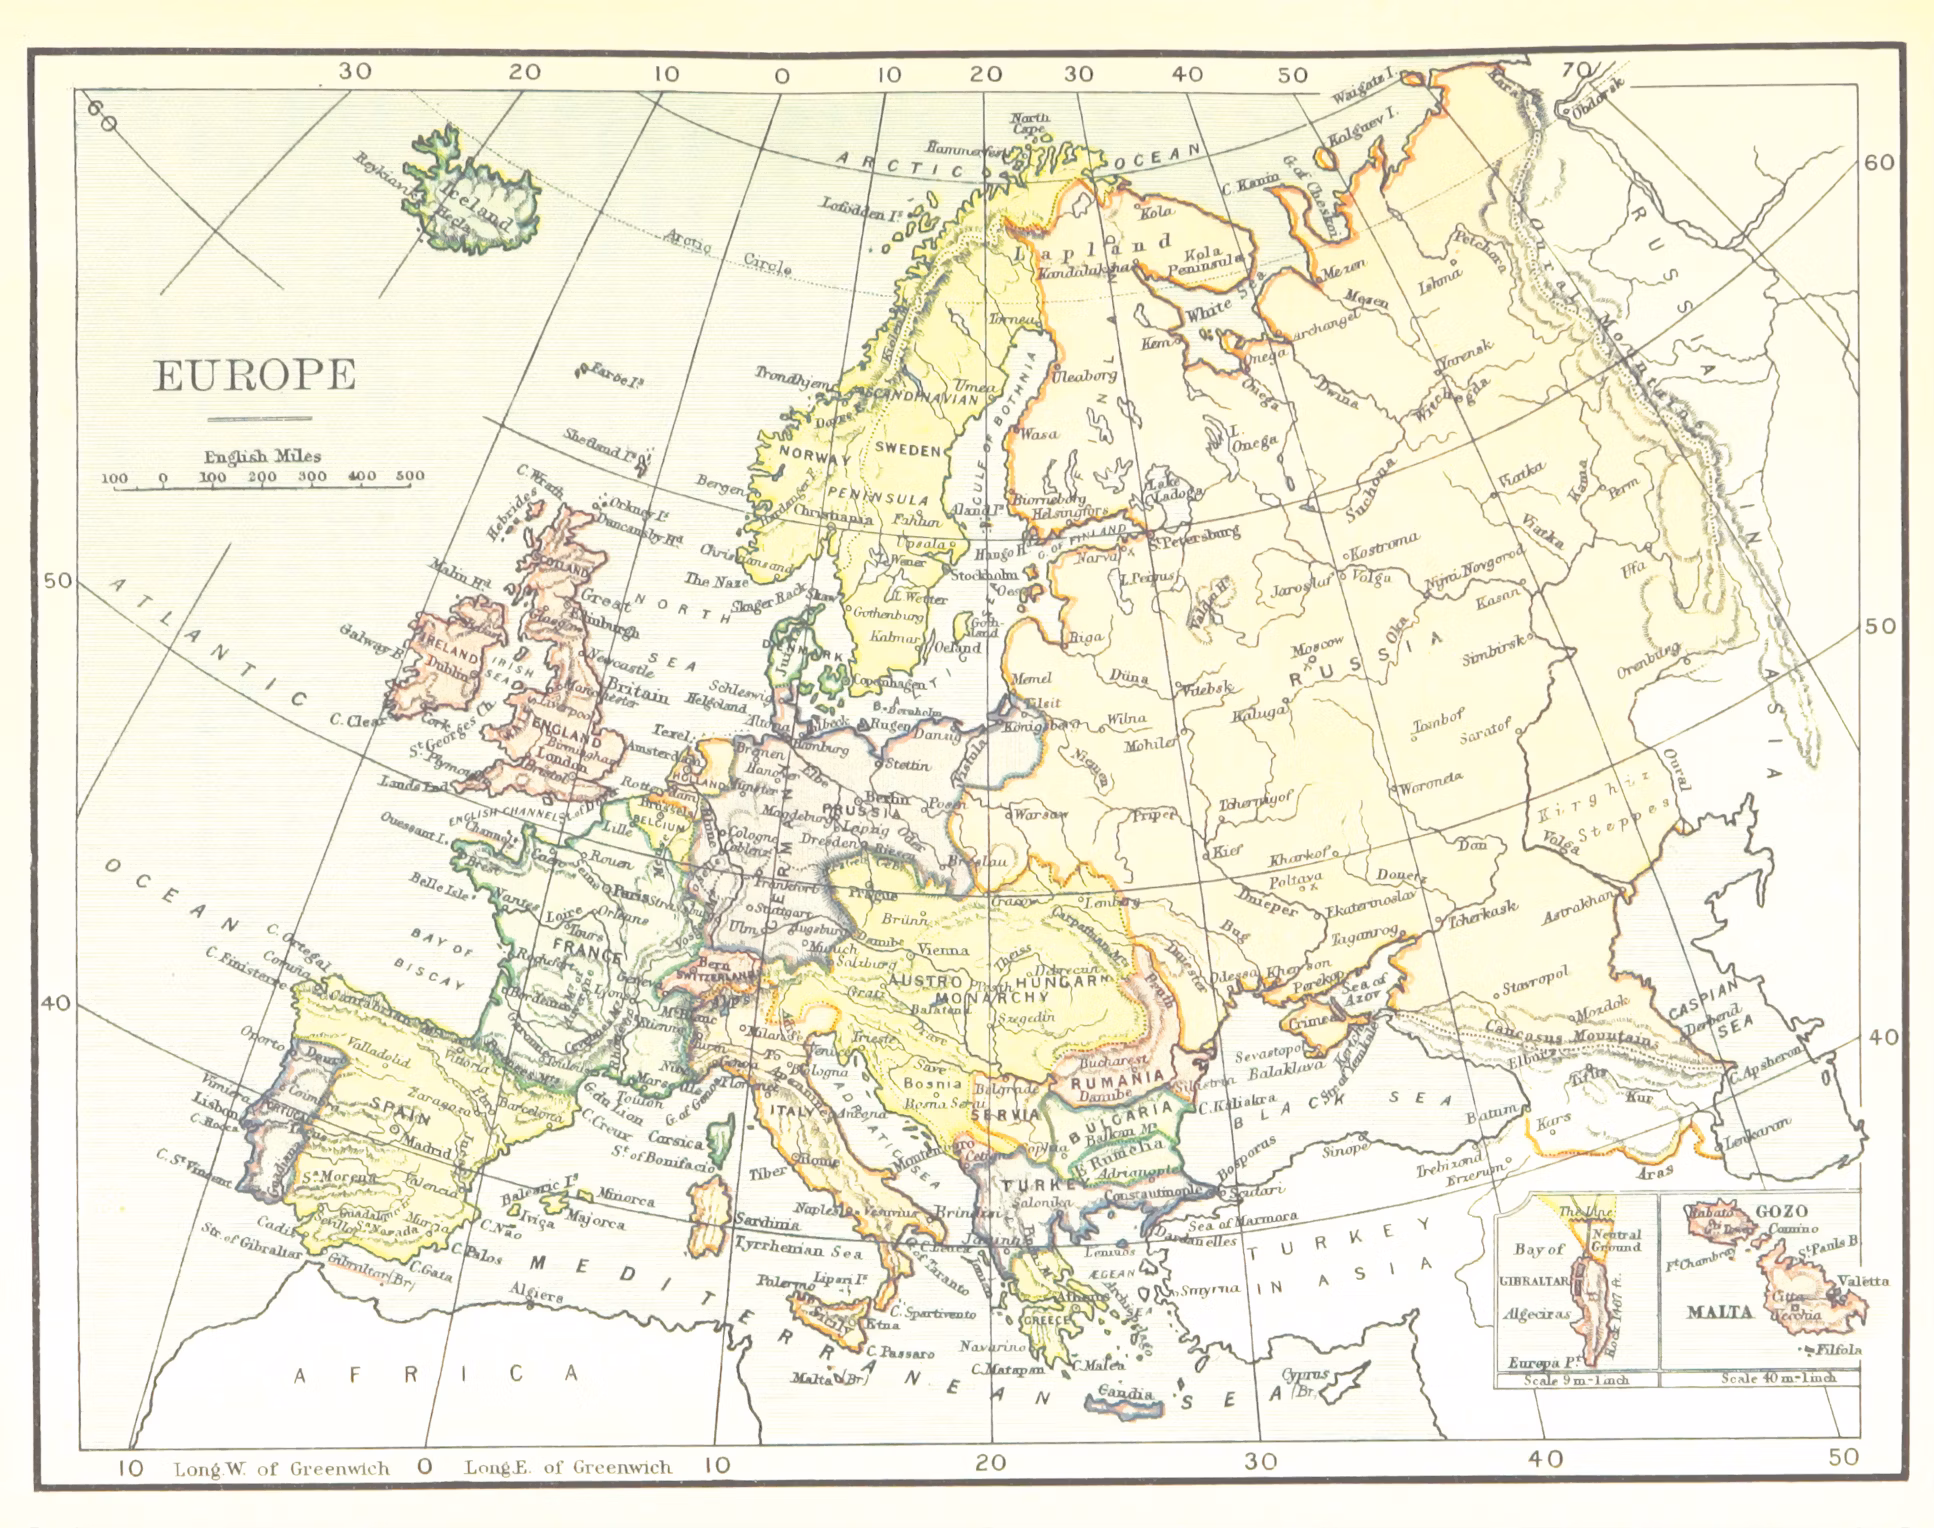
Your browser will natively display common raster image formats [PNG, JPEG, etc.]. These contains raster [Pixelized Data] which essentially means there is a hard-coded grid of color information. This is regardless of the encoding or representation of the data - such as JPEGs encoding in YUV color coordinates and compressed using frequency coefficients for each JPEG block - its still a grid of pixel data the encoding is representing.
None of the pixels themselves have any metadata or any associated tags. This means working with PNGs, JPEGs, and other rasterized image data to extrapolate features involves higher order steps and far more compute such as image recognition and Data Mining algorithms.
Vector Images
You might also run across vector image formats, such as SVG, especially for things such as ICONs
These add flexibility and functionality such as interaction by Javascript with inline SVG files that can add manipulation such as shading, filling, transformations, or others.
This allows prescribing attributes to certain vector paths, and allowing you to do things like interactive zooming and clicking one browser / UI events. For example
//The code to get edit the HTML components upon clicking look like
const population = event.target.getAttribute('data-population');
document.getElementById('selectedCounty').innerText = 'Selected County ID: ' + event.target.id + "with population" + population;
//The code to build the bottom SVG looks like
const sideMapObject = document.getElementById('SideMap');
sideMapObject.innerHTML = ''; // Clear existing content
// Create a new SVG element
//Base SVG E
const newSVG = document.createElementNS('http://www.w3.org/2000/svg', 'svg');
newSVG.setAttribute('width', '100%');
newSVG.setAttribute('height', '100%');
newSVG.setAttribute('viewBox', event.target.getBBox().x + ' ' + event.target.getBBox().y + ' ' + event.target.getBBox().width + ' ' + event.target.getBBox().height);
// Clone the polyline and append it to the new SVG
const clonedPolyline = event.target.cloneNode(true);
newSVG.appendChild(clonedPolyline);
// Append the new SVG to the SideMap
sideMapObject.appendChild(newSVG);Point is, because of the vector / coordinate makeup of SVGs allow for native javascript interaction as a native DOM element that can access Polyline, Polygon, and other shape’s metadata inside of a SVG file.
SVGs also allow variable resolution at zoom - so SVGs are better than rasterized images at holding high resolution data. Rendering vector images involves transforming vectors at a certain zoom, alongside fill information, etc. to essentially raster data to the framebuffers and graphical hardware to display on your screen, just like rasterized images.
But Digital Maps allow richer Layering, Display, filtering, information requesting and response protocols, and calculations on data than SVG images alone can.
Digital Maps UIs
Digital Map UIs and builders come in many forms such as ArcGis, QGis, other geospatial software, WEB UI APIs such as OpenLayers, and others.
Digital Maps allow to you to build “Layers” composed on top of each other, and can interact with a variety of data sources, such as KML, GeoJSON, Shapefiles, GeoPackages, and some other propietary and open standard formats.
Some standardized protocols such as WMS, WCS, and WFS provide a standardization for requests to a GeoServer for different formats of data.
On the client side, usually digital maps have powerful tools for displays, such as Heat Maps, Filtering, Clustering, Symbols, etc.
An Example of Clustering
An Example of Heat Maps
In this example, Clustering groups together power plants nearby when zoomed out, and breaks clusters apart when zoomed in.
The heat map demonstrates the density of the existence of power plants across the map.
General Types Of Data Digital Maps Process
Each piece of Data Will Comprise of a “Layer” on the map. A layer is an abstraction that allows behavior to apply to it - such as how its displayed on the map and how it is requested and filtered.
Raster Data (Images)
Raster Data is Map Data displayed as pixels on the screen, and often do not have any functionality despite being the background / reference image for the overlayed maps.
Tiled Raster Maps
Allows the client to request partitions of the map to decrease the amount of requests to the server. This allows lower network data transfers.
For example:
https://tile.openstreetmap.org/4/15/4.png
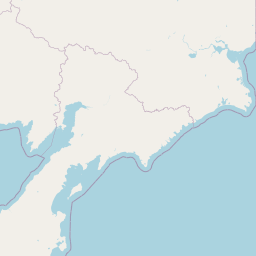
Zoom Level 4, Tile Coordinates [15,4]
Vector Data
Vector Data is different than raster data because it isn’t just an image to display, but information about the components of the map’s information gets passed to the client, which then chooses how to render it. This allows different types of displays such as elevation maps, heat maps, clustering, etc.
Vector Data includes geometries such as Points, Polygons, MultiPolygons, Lines, etc.
Tiled Vector Data
Similar to Tiled Raster Data, allows filtering in the client request (on the server side).
Exact Types
In the above section, I explained generally that raster or vector types exist for displaying on maps. However, these can come in different formats.
Vector Types
- KML
- GeoJSON
- Shapefiles
- GeoPackages
Raster Options
- KML
- GeoPackages
- GeoTIFF
- Image Formats [JPEG, PNG, etc.]
Back To Infrastructure
Electrical
Where does electrical power get generated and where does it attach to the grid?
What kind of electrical power sources exist at certain locations?
Where are transmission lines for long distance electricity hauling?
Power Plants
https://www.arcgis.com/apps/mapviewer/index.html?webmap=b1f22fb7ce9242ed9c6800f970a34e84
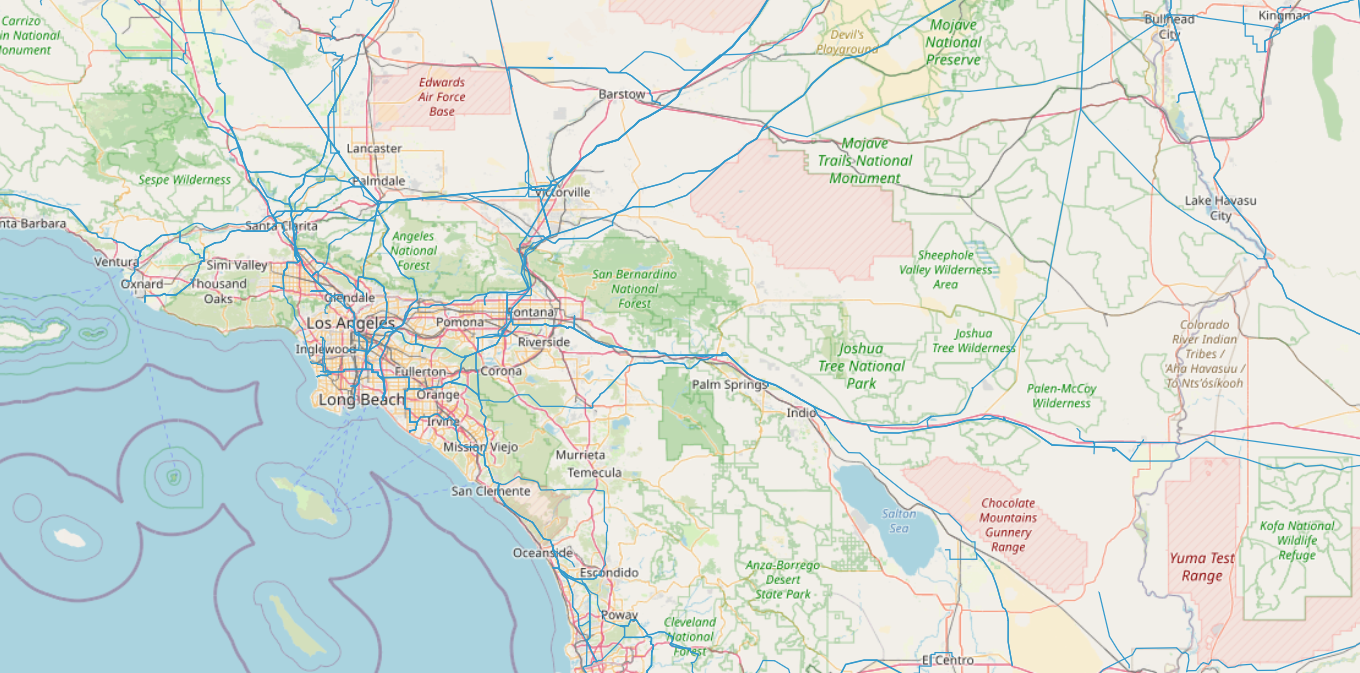
Transmission Lines Map
https://hub.arcgis.com/datasets/d4090758322c4d32a4cd002ffaa0aa12/explore
Zoom in to a location to see the transmission lines, you can find substations where transmission lines end.
Filtered Transmission Lines
Shipping
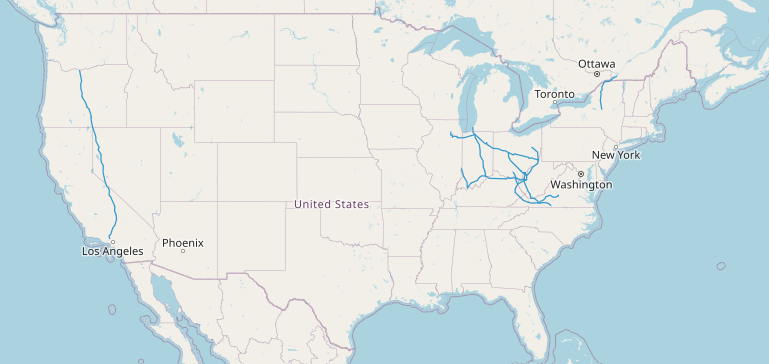
Freight
https://www.acwr.com/economic-development/rail-maps/union-pacific
International Shipping Routes
https://www.arcgis.com/home/webmap/viewer.html?webmap=940902bb15fc449c9ff840dd622cc42c
International Ports
https://hub.arcgis.com/datasets/1e7dfd86350e4e00b722b943a02cb14c/explore
Plumbing
Internet
Internal details of a lot the internet are both propietary and largely too complicated to be displayed as geographic maps, but you can see a lot of the most major and high volume infrastructure that makes up the global internet.
Thinks like private peering agreements between two Autonomous Systems, internal Internet Exchange Point agreements (IXPs), which part of the address
Underwater Sea Cables
Underwater Sea Cables are low in volume , high capacity, connections across the ocean that allows the internet to operate globally.
https://www.submarinecablemap.com/
IXPs (Internet Exchange Points)
IXPs are one of two ways for different Networks to peer with each other and exchange routing information for the global internet using the BGP protocol. This is contrary to “Private Peering Links”.
https://www.internetexchangemap.com/#/building/19230
AWS Data Center Locations